
In this post
It is argued that the sharing economy generates negative externalities, such as the attraction of predominantly low-quality tourism that ignites urban conflicts and reduces the resilience of cities, modifying the quality of life in certain neighborhoods where gentrification, pollution, or noise increases. All in all, what has been the impact of tourist apartments on the air quality and noise levels of Madrid and Barcelona?
To answer this question, we are collaborating on a research project entitled The Impact of Peer-to-Peer Apartments on City Resilience Before and After COVID-19, directed by PhD José María Raya Vílchez from Tecnocampus UPF, an affiliated center of Universitat Pompeu Fabra. Our mission, as always, is to unlock the value of satellite imagery thanks to artificial intelligence, making satellite analytics accessible, easy, and useful. Knowing that satellite data is difficult to understand, we want to demonstrate once again all the potential that can be obtained from it.
Thus, what we are doing in this project is crossing satellite data with different data sources. On the one hand, we use satellite data from Sentinel-5P, the first Copernicus mission dedicated to performing atmospheric measurements for air quality monitoring. We monitor the temporal trends in the concentrations of several air pollutants such as CO, CO2, SO2, and O3. On the other hand, we have an occupancy database of Airbnb tourist apartments and noise level data from the open data portals of Madrid and Barcelona.
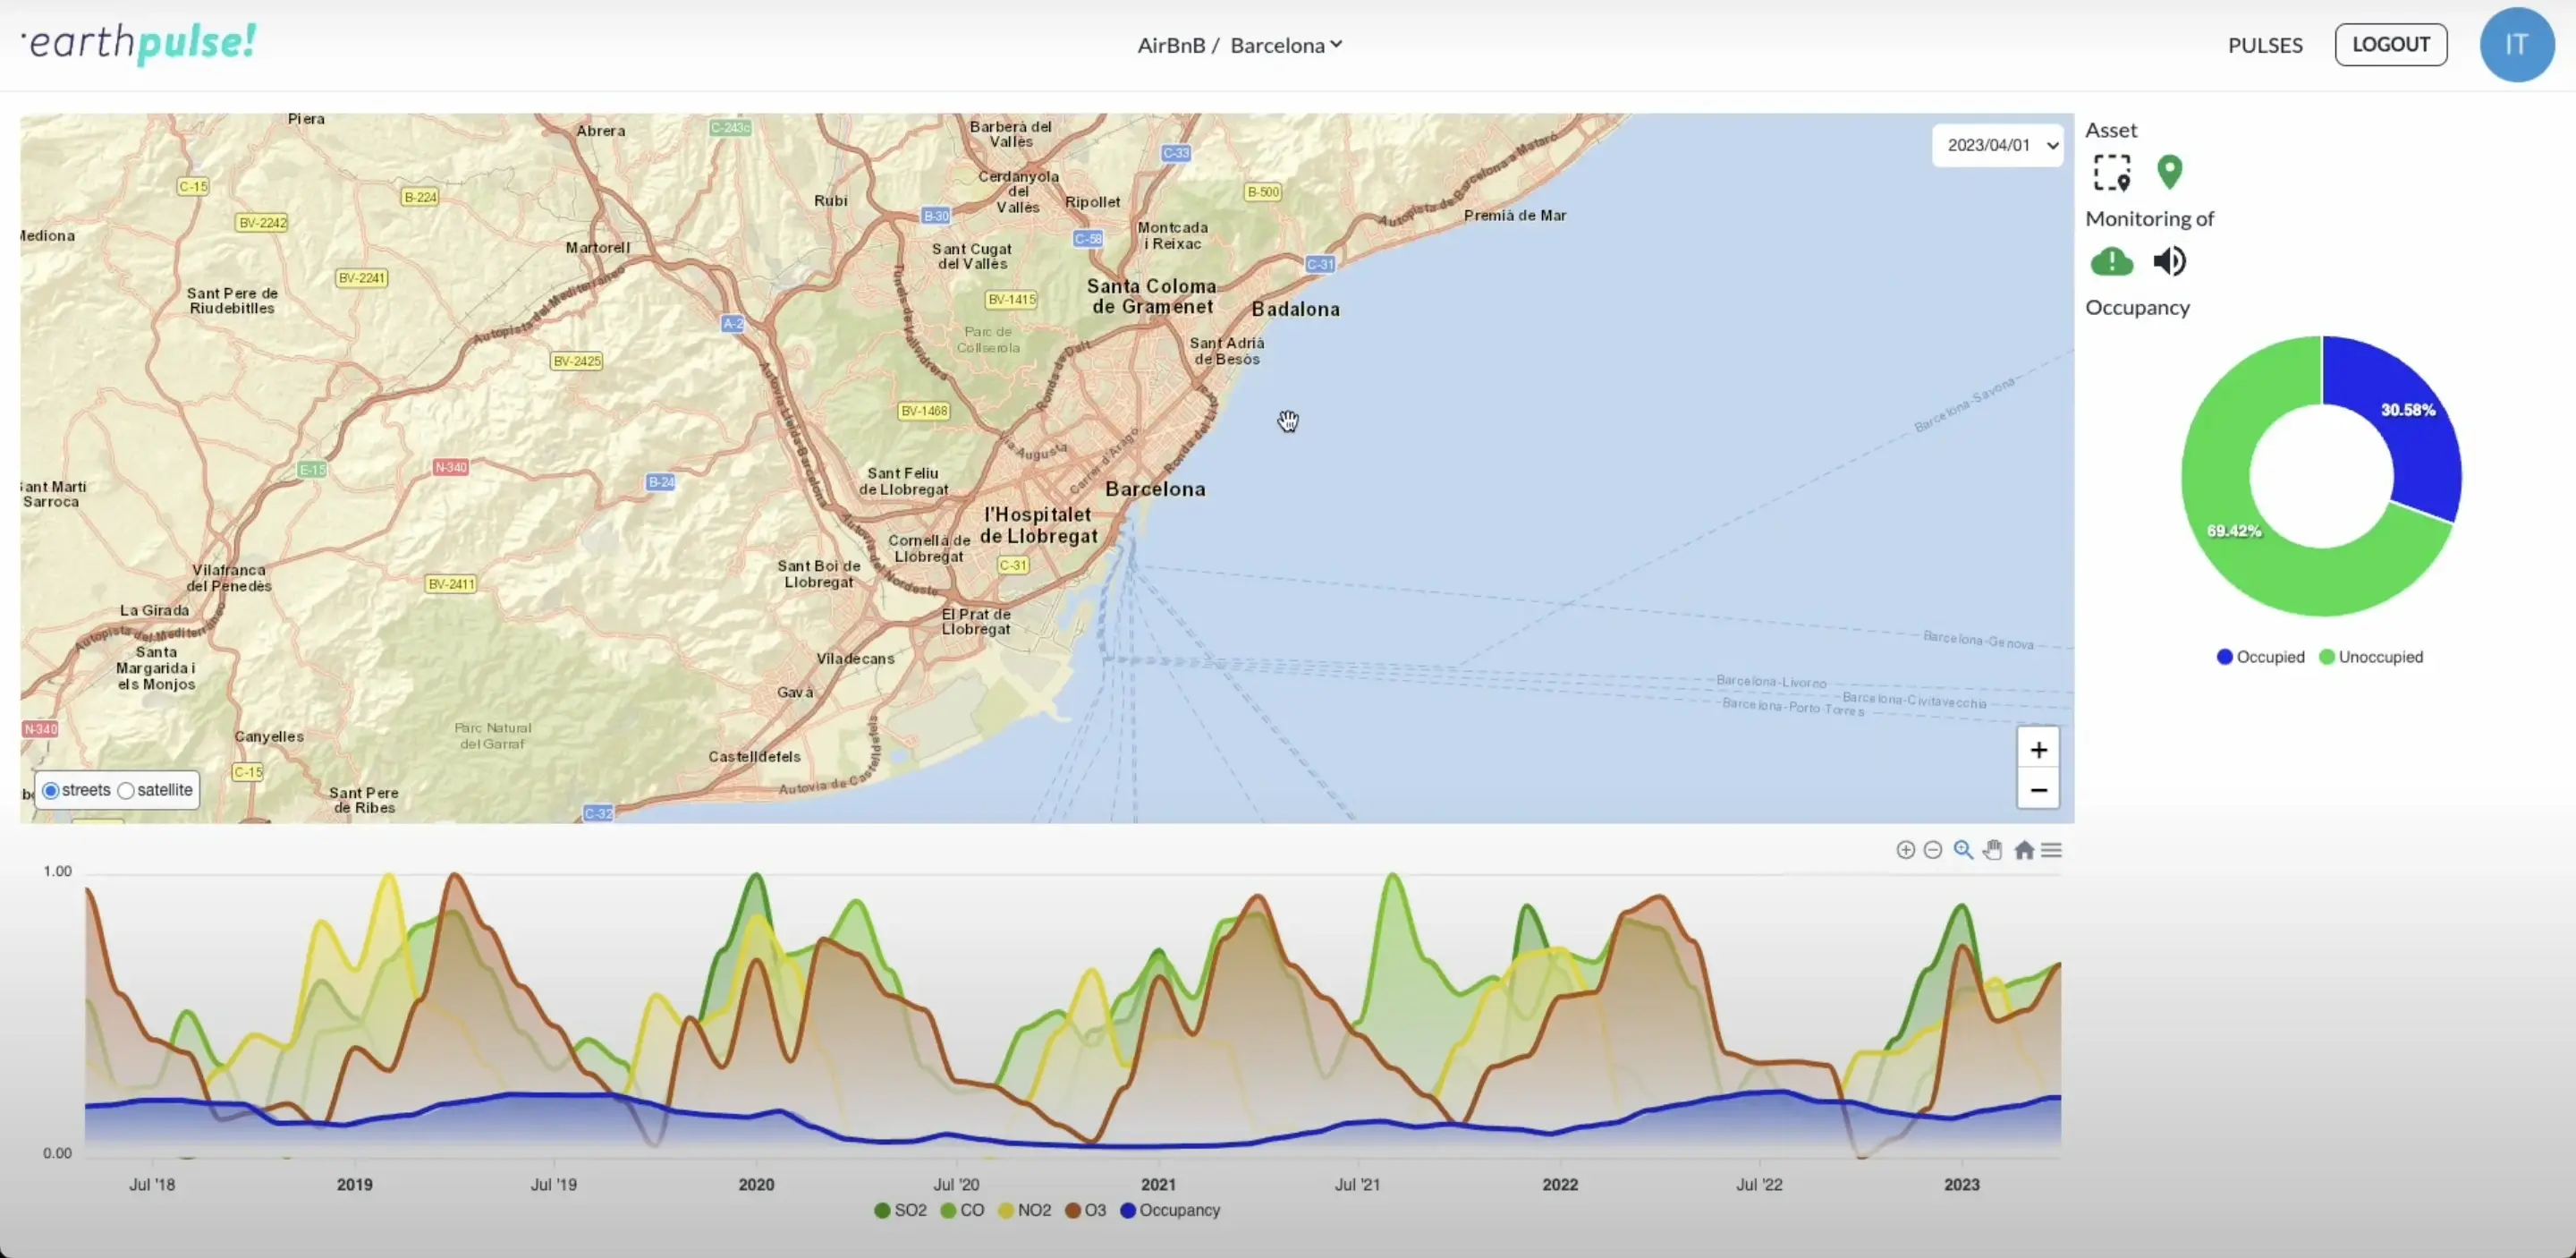
With all this, we have developed and deployed Airbnb PULSE. This platform, currently being used by the research team led by José María Raya Vílchez, allows us and the team to analyze and cross-reference satellite data with other data sources in an agile way. Whether public or private data, we integrate any additional data sources in a matter of minutes. The availability of historical air pollutant data allows us to study the impact of tourism on air quality historically and to study correlations from years ago, provided occupancy data is available. Thus, and through the platform's dashboard, all these indicators can be easily and friendly consumed, allowing observation of the evolution of occupancy, pollutants, or noise levels over time, either at the city or district level (see video below).
In terms of research and results, the time interval covered by the study is between 2018 and 2023, with the aim of evaluating the impact of tourism on the resilience of Madrid and Barcelona before, during, and after the COVID pandemic. The main limitation in this regard was obtaining tourist occupancy data, and we finally obtained an Airbnb occupancy database, considering that both satellite data and noise data are open and free.
Contrary to expectations, with the increase in occupancy and tourism, the air quality in cities has been found to improve. Air pollution decreases during times of greatest tourist occupation, typically in the summer, possibly due to a greater propensity to use public transport and a decrease in work activity in cities. This is something that many city residents are aware of, but with this study, we provide real and objective results.
Now, let's delve into the impact of tourism on the air quality of Barcelona.
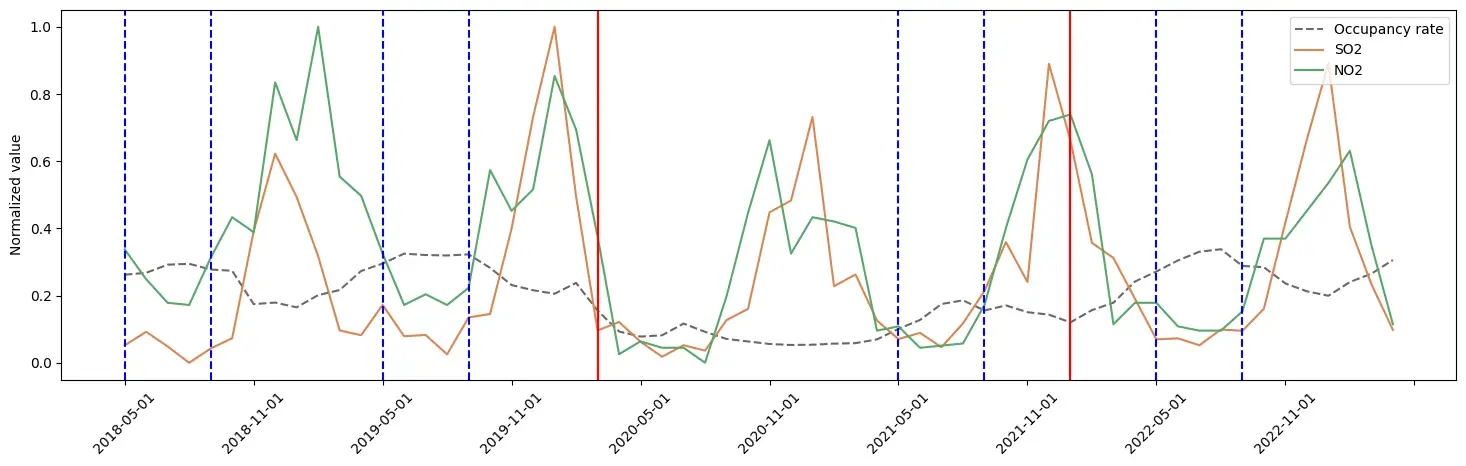
What we see here is the time series of occupancy and concentrations of SO2 and NO2 between 2018 and 2023 in Barcelona. The red vertical lines indicate the beginning and end of the COVID-19 pandemic, and the blue lines represent the moments of highest occupancy (summer). Some key insights:
- It is easy to see that the months with higher occupancy correspond to the months with lower concentrations of atmospheric pollutants.
- As expected, the pandemic causes occupancy to drop and remain stable until the end of the pandemic when it rises again, establishing a pattern.
Now, let's take a look at the noise levels!
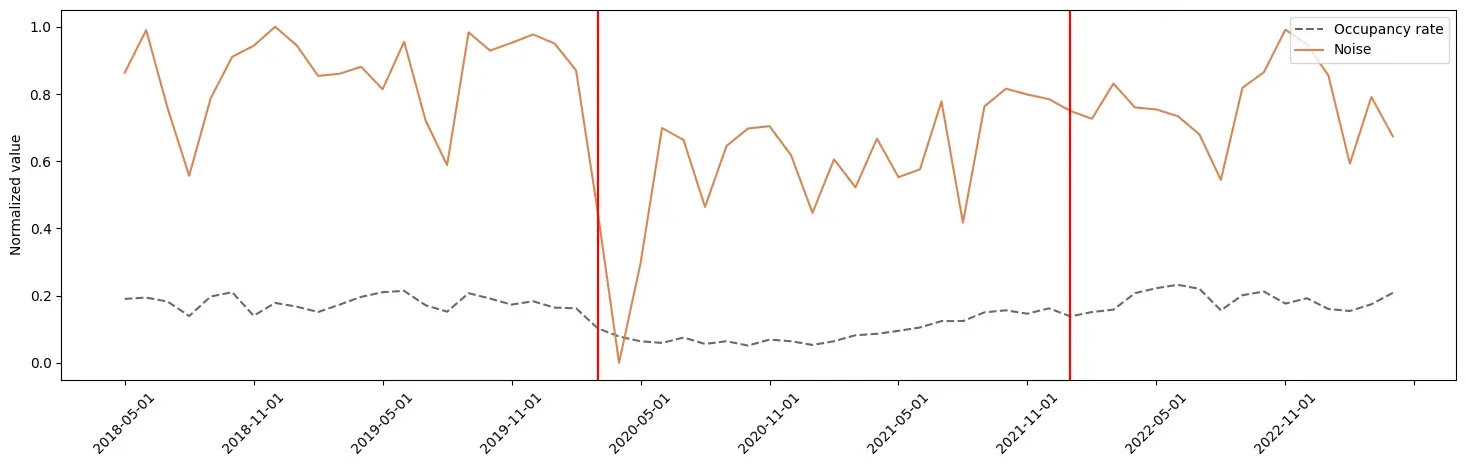
Here, what we see is the time series of occupancy and noise levels in the Chamberí district of Madrid between 2018 and 2023. As before, the red vertical lines indicate the beginning and end of the COVID-19 pandemic. It is evident that there is a correlation between occupancy and noise, with occupancy increases leading to higher noise levels, and vice versa.
Despite the study being conducted in Madrid and Barcelona, we could extend it to the main provincial capitals of Spain, and we even want to make international correlations if consistent with the type of tourism.
This is an example of the type of analysis and services we provide at Earthpulse. We aim to make satellite data accessible to everyone by developing solutions that any company can use, such as insurers calculating the risk of fire or flooding for their assets, farmers assessing the health of their crops, or utility companies monitoring water bodies and key performance indicators that signal poor conditions, drought, or a reduction in green areas due to decreased rainfall. Feel free to check out some of our use cases!


